Monitor
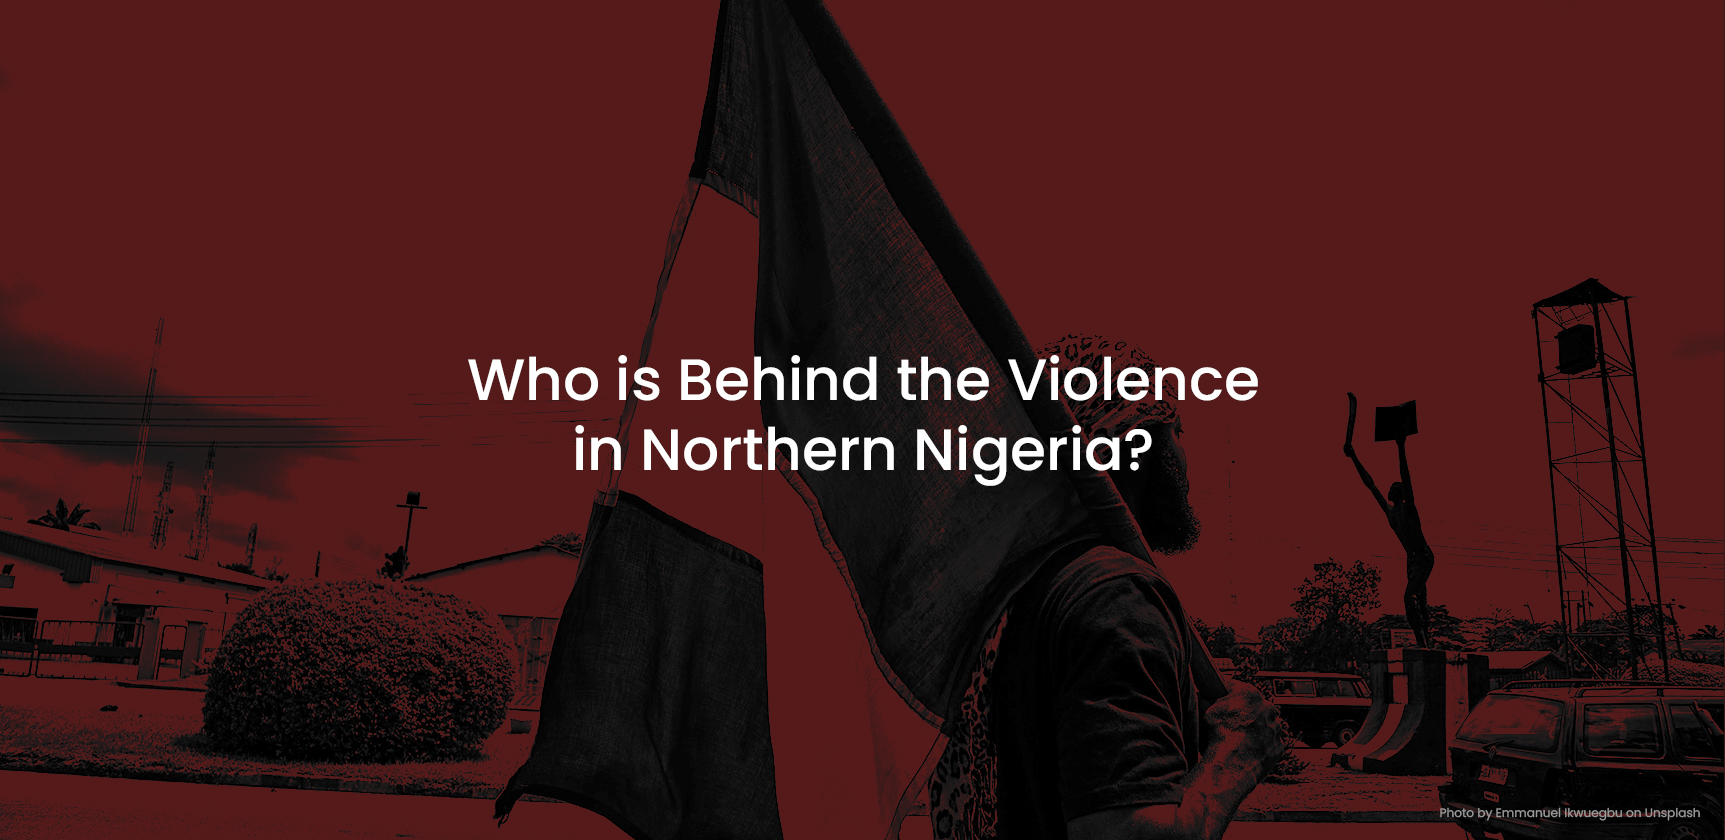
Who Is Behind the Violence in Northern Nigeria?
By Steven Kefas
Nigeria is often portrayed in international headlines as simply “unstable,” a sweeping, unhelpful label that conceals a far more complex and geographically specific crisis. For ...
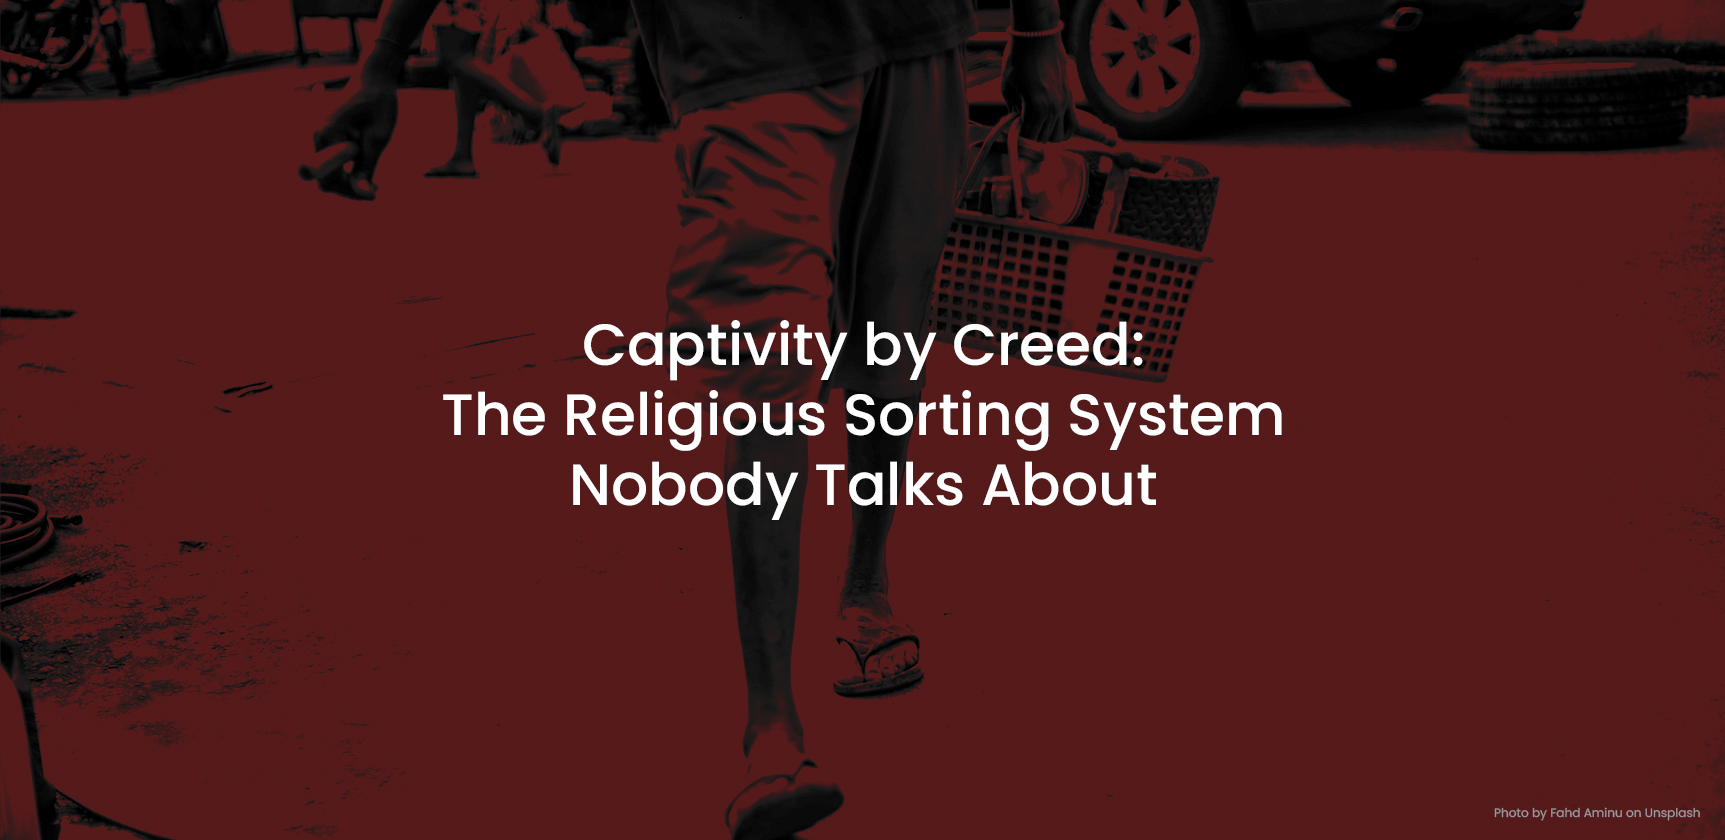
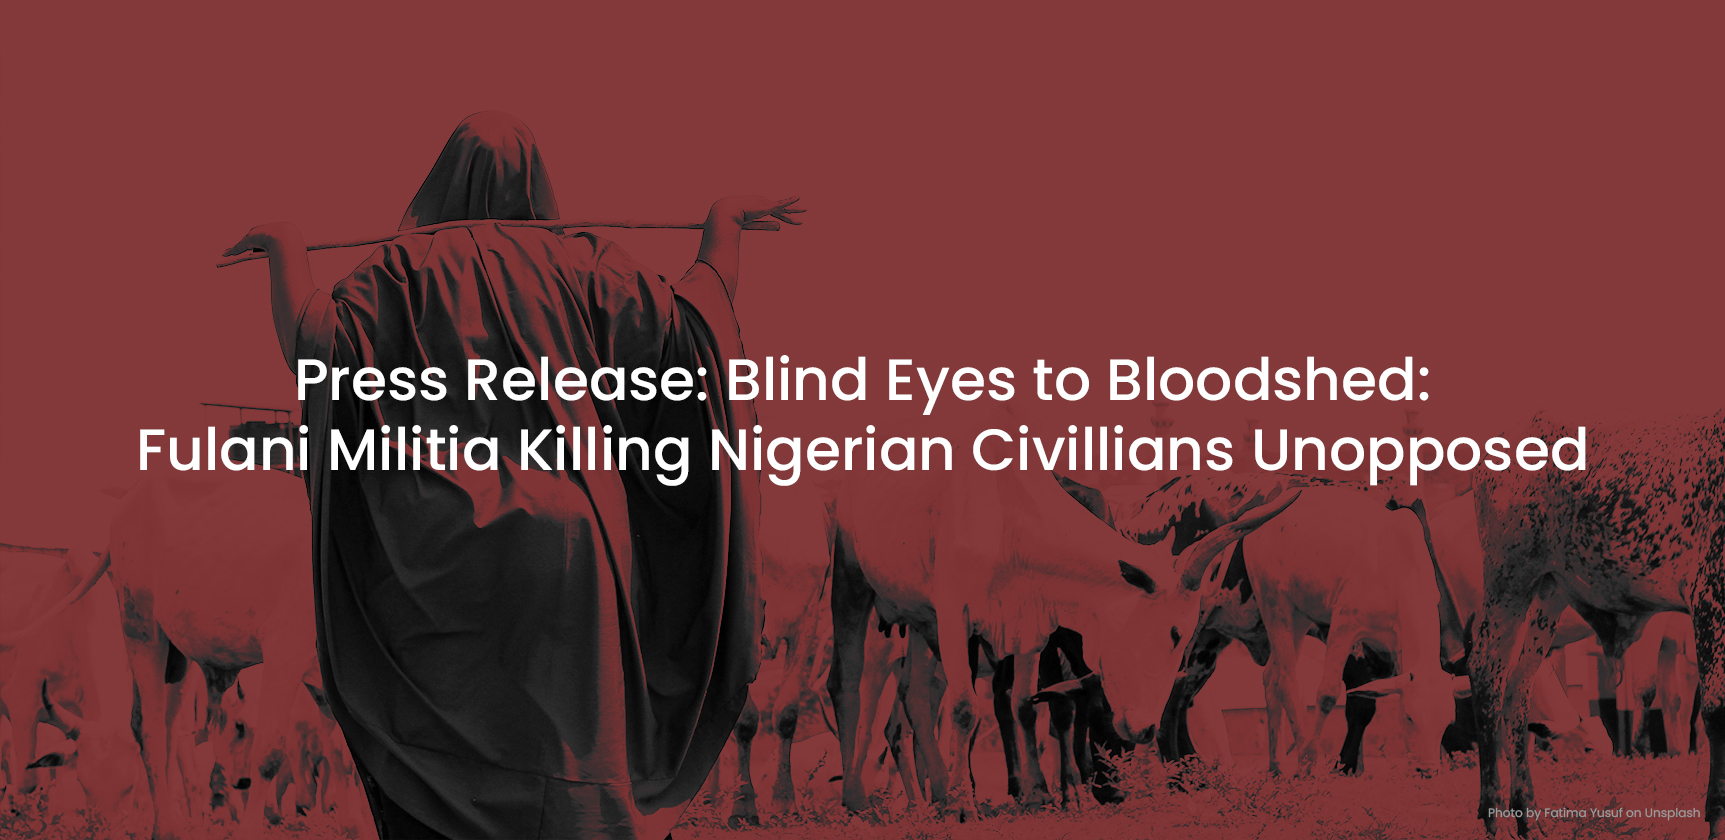
Captivity by Creed: The Religious Sorting System Nobody Talks About
Inside the two-tier captivity system of Fulani ethnic militias — where faith determines who suffers, how much a life is worth, and whether a hostage comes home at all.
By Steven Kefas, May 2026
...
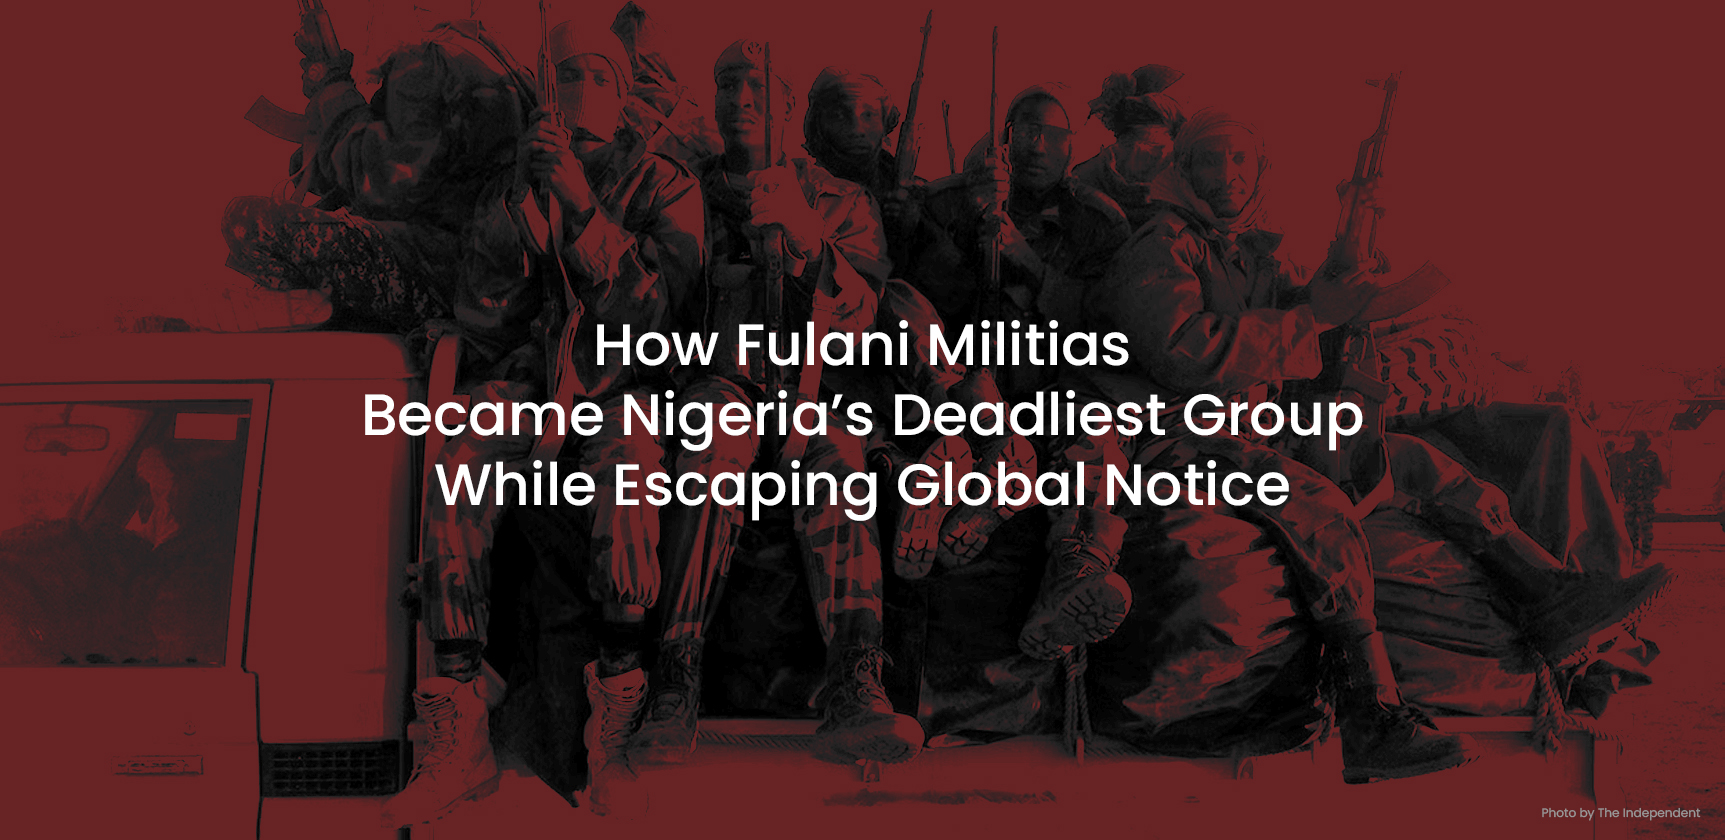
How Fulani Militias Became Nigeria’s Deadliest GroupWhile Escaping Global Notice
By Steven Kefas
In 2015, when the Global Terrorism Index (GTI) ranked Armed Fulani militants as the fourth deadliest terror group in the world, Nigeria was already grappling with the brutal reality...
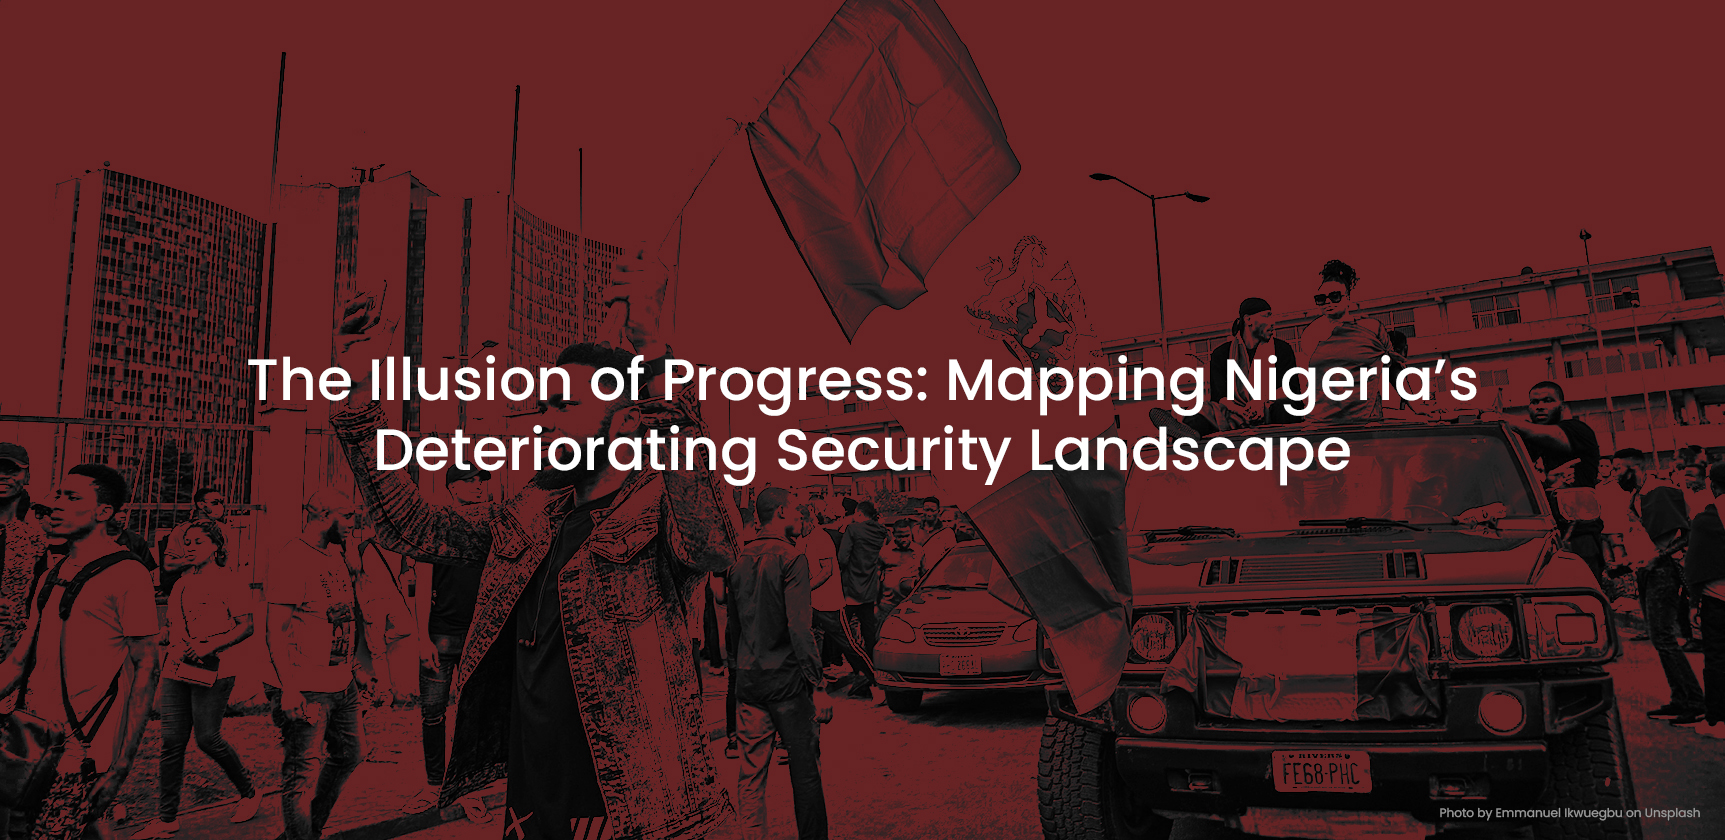
The Illusion of Progress: Mapping Nigeria’s Deteriorating Security Landscape
By Steven Kefas or Observatory for Religious Freedom in Africa (ORFA)
As President Bola Tinubu marks his second year in office this May, a comprehensive analysis of Nigeria's security landscape rev...
Mass killings, abductions and torture of whole families go largely unchallenged as military pursue targets hundreds of miles away, finds four-year data project
Islamist extremists enjoy relative freedom to carry out atrocities against civilians in large regions of Nigeria, according to data scientists behind a four-year study.
Researchers at the Observato...
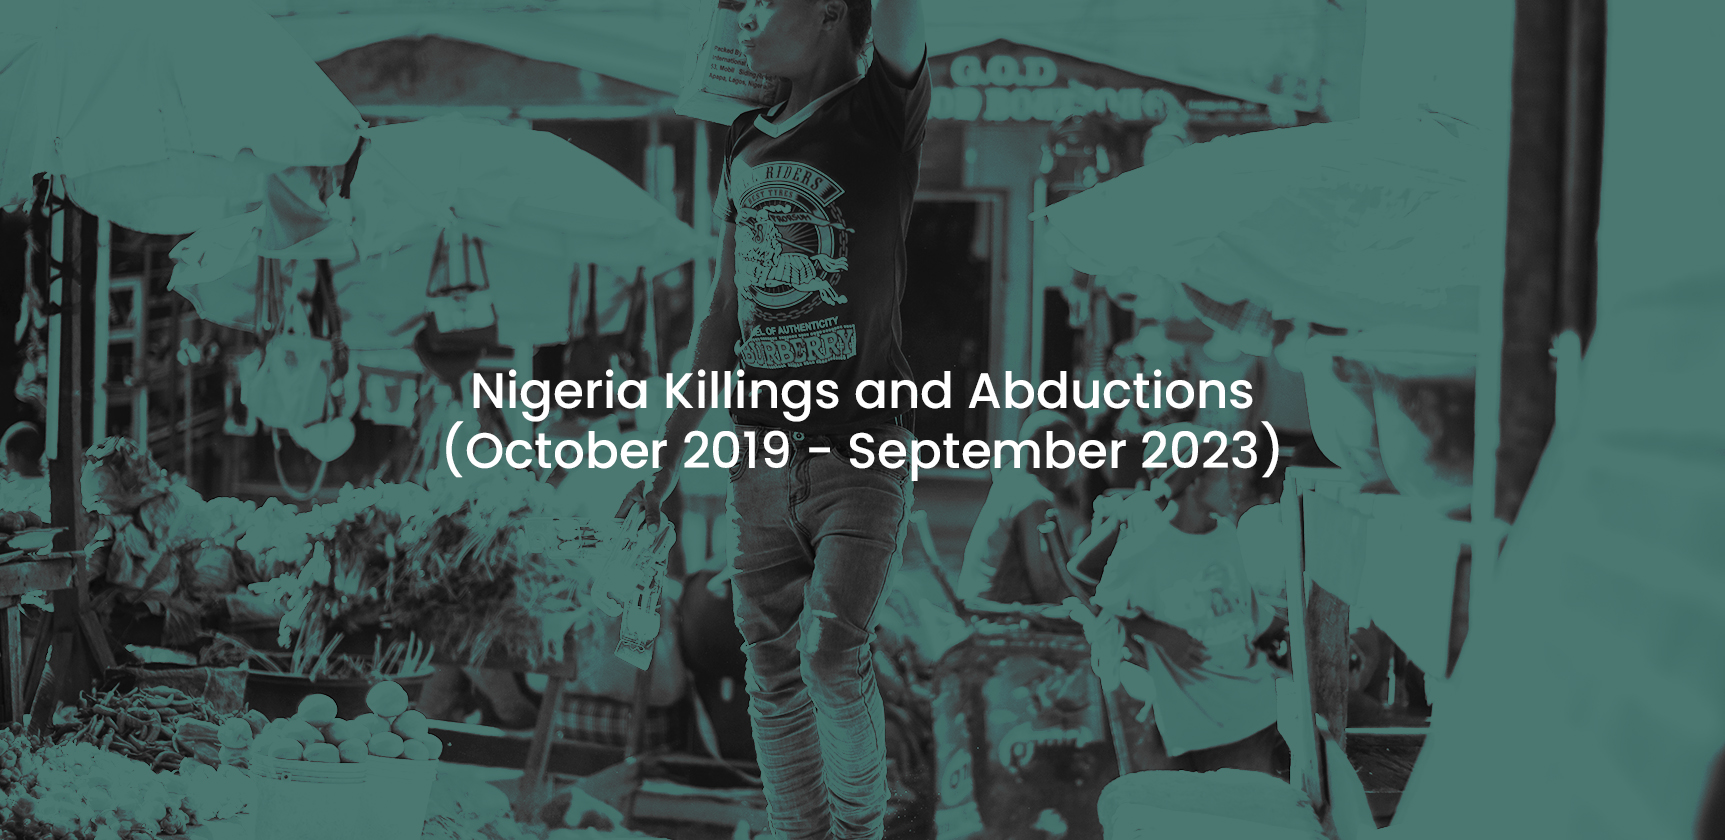
Nigeria Killings and Abductions (October 2019 – September 2023)
This 4-rear report provides an overview of violence in Nigeria Click here to download the report.